Highcharts JS เป็น JavaScript library สำหรับสร้าง Chart ในรูปแบบต่าง ๆ โดยสามารถใช้ได้ฟรี เฉพาะกับโปรเจ็คส่วนบุคคล
ในบทความนี้ เราจะแนะนำการใช้งาน Highchart แสดงข้อมูล โดยนำข้อมูลจากฐานข้อมูล MySQL มาแสดงผลบนหน้าเว็บ ในรูปแบบ Chart ต่าง ๆ
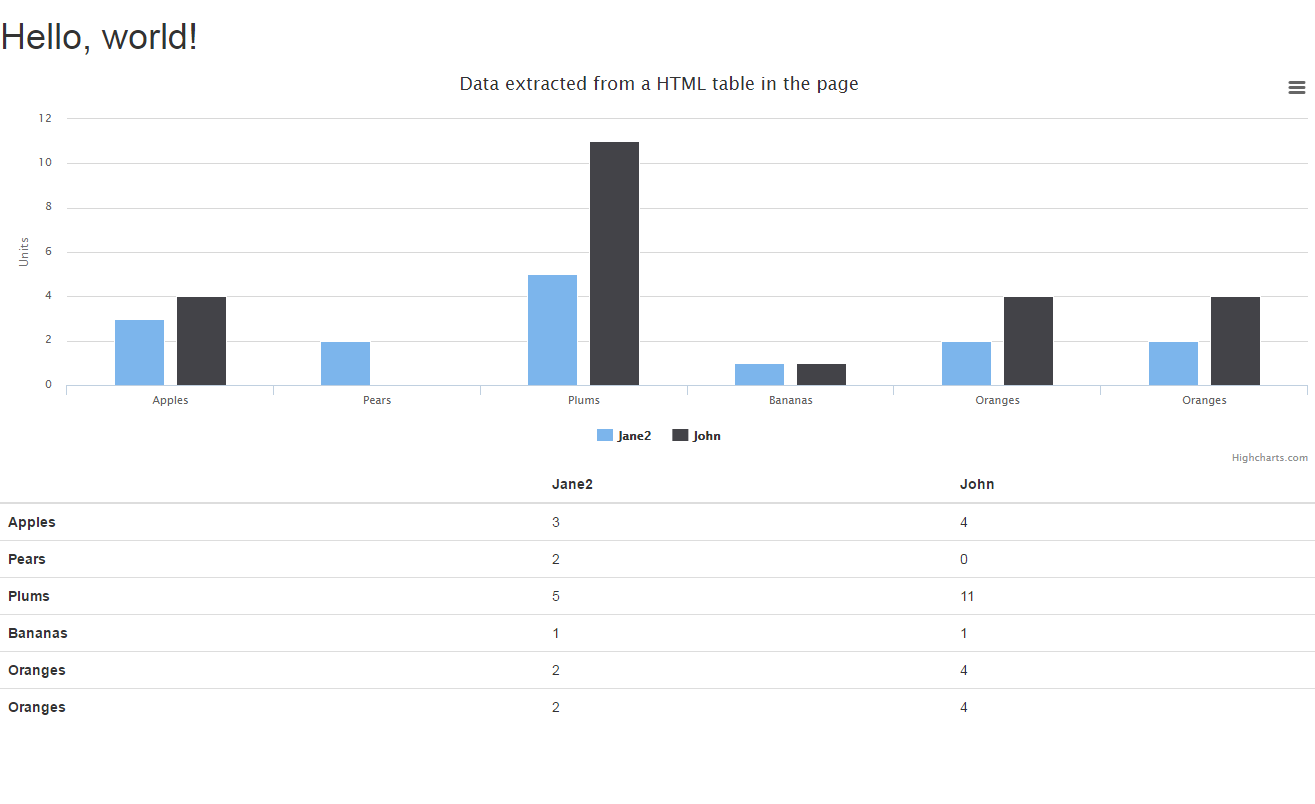
1.Chart แบบ Data defined in a HTML table โดยจะนำข้อมูลจาก table มาแสดงเป็น กราฟ ซึ่งอันนี้ค่อนข้างสะดวกครับ เพราะว่าข้อมูลใน Table เป็นอย่างไร ก็จะนำมาแสดงเป็น Graph ให้อัตโนมัติ
<!DOCTYPE html>
<html lang="en">
  <head>
    <meta charset="utf-8">
    <meta http-equiv="X-UA-Compatible" content="IE=edge">
    <meta name="viewport" content="width=device-width, initial-scale=1">
    <!-- The above 3 meta tags *must* come first in the head; any other head content must come *after* these tags -->
    <title>การใช้งาน Highcharts JS With PHP MySQL</title>

    <!-- Bootstrap -->
    <!-- Latest compiled and minified CSS -->
<link rel="stylesheet" href="https://maxcdn.bootstrapcdn.com/bootstrap/3.3.6/css/bootstrap.min.css" integrity="sha384-1q8mTJOASx8j1Au+a5WDVnPi2lkFfwwEAa8hDDdjZlpLegxhjVME1fgjWPGmkzs7" crossorigin="anonymous">

    <!-- HTML5 shim and Respond.js for IE8 support of HTML5 elements and media queries -->
    <!-- WARNING: Respond.js doesn't work if you view the page via file:// -->
    <!--[if lt IE 9]>
      <script src="https://oss.maxcdn.com/html5shiv/3.7.2/html5shiv.min.js"></script>
      <script src="https://oss.maxcdn.com/respond/1.4.2/respond.min.js"></script>
    <![endif]-->
  </head>
  <body>
    <h1>Hello, world!</h1>

		<div id="container" style="min-width: 310px; height: 400px; margin: 0 auto"></div>

		<table class="table" id="datatable">
			<thead>
				<tr>
					<th></th>
					<th>Jane2</th>
					<th>John</th>
				</tr>
			</thead>
			<tbody>
				<tr>
					<th>Apples</th>
					<td>3</td>
					<td>4</td>
				</tr>
				<tr>
					<th>Pears</th>
					<td>2</td>
					<td>0</td>
				</tr>
				<tr>
					<th>Plums</th>
					<td>5</td>
					<td>11</td>
				</tr>
				<tr>
					<th>Bananas</th>
					<td>1</td>
					<td>1</td>
				</tr>
				<tr>
					<th>Oranges</th>
					<td>2</td>
					<td>4</td>
				</tr>
				<tr>
					<th>Oranges</th>
					<td>2</td>
					<td>4</td>
				</tr>
			</tbody>
		</table>

	<script src="https://code.jquery.com/jquery-1.12.0.min.js"></script>
	<script src="https://code.highcharts.com/highcharts.js"></script>
	<script src="https://code.highcharts.com/modules/data.js"></script>
	<script src="https://code.highcharts.com/modules/exporting.js"></script>

	<script>

	$(function () {

		$('#container').highcharts({
			data: {
				table: 'datatable'
			},
			chart: {
				type: 'column'
			},
			title: {
				text: 'Data extracted from a HTML table in the page'
			},
			yAxis: {
				allowDecimals: false,
				title: {
					text: 'Units'
				}
			},

			tooltip: {
				formatter: function () {
					return '<b>' + this.series.name + '</b><br/>' +
						this.point.y + ' ' + this.point.name.toLowerCase();
				}
			}
		});
	});

	</script>

  </body>
</html>
ตัวอย่างการแสดงผล
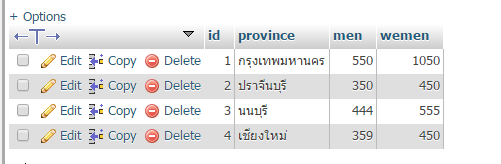
2.การแสดงข้อมูลในตารางจากฐานข้อมูล MySQL เราเพียงแค่ แสดงข้อมูลใน Table ตัว Highchart ก็จะแสดงข้อมูลเป็น Graph ให้ อัตโนมัติ แต่ต้องกำหนดรูปแบบข้อมูลให้ตรงกับรูปแบบของข้อมูลตัวอย่างครับ
ตัวอย่าง สร้างฐานข้อมูลชื่อ demo สร้างตาราง ชื่อ chart มีข้อมูลดังนี้
ตัวอย่าง ไฟล์ table_chart.php
<?php
	//ตั้งค่าการเชื่อมต่อฐานข้อมูล
	$database_host 			= 'localhost';
	$database_username 		= 'root';
	$database_password 		= '';
	$database_name 			= 'demo';

	$mysqli = new mysqli($database_host, $database_username, $database_password, $database_name);
//กำหนด charset ให้เป็น utf8 เพื่อรองรับภาษาไทย
	$mysqli->set_charset("utf8");

//กรณีมี Error เกิดขึ้น
	if ($mysqli->connect_error) {
		die('Error : ('. $mysqli->connect_errno .') '. $mysqli->connect_error);
	}
		//เรียกข้อมูลจาก ตาราง chart
		$get_data = $mysqli->query("SELECT * FROM chart");

		while($data = $get_data->fetch_assoc()){

			$result[] = $data;
		}
?>

<!DOCTYPE html>
<html lang="en">
  <head>
    <meta charset="utf-8">
    <meta http-equiv="X-UA-Compatible" content="IE=edge">
    <meta name="viewport" content="width=device-width, initial-scale=1">
    <!-- The above 3 meta tags *must* come first in the head; any other head content must come *after* these tags -->
    <title>การใช้งาน Highcharts JS With PHP MySQL</title>

    <!-- Bootstrap -->
    <!-- Latest compiled and minified CSS -->
<link rel="stylesheet" href="https://maxcdn.bootstrapcdn.com/bootstrap/3.3.6/css/bootstrap.min.css" integrity="sha384-1q8mTJOASx8j1Au+a5WDVnPi2lkFfwwEAa8hDDdjZlpLegxhjVME1fgjWPGmkzs7" crossorigin="anonymous">

    <!-- HTML5 shim and Respond.js for IE8 support of HTML5 elements and media queries -->
    <!-- WARNING: Respond.js doesn't work if you view the page via file:// -->
    <!--[if lt IE 9]>
      <script src="https://oss.maxcdn.com/html5shiv/3.7.2/html5shiv.min.js"></script>
      <script src="https://oss.maxcdn.com/respond/1.4.2/respond.min.js"></script>
    <![endif]-->
  </head>
  <body>
    <h1>Hello, world! ข้อมูลทดสอบ</h1>

		<div id="container" style="min-width: 310px; height: 400px; margin: 0 auto"></div>

		<table class="table" id="datatable">
			<thead>
				<tr>
					<th></th>
					<th>ประชากรหญิง</th>
					<th>ประชากรชาย</th>
				</tr>
			</thead>
			<tbody>
				<?php
					foreach($result as $result_tb){
						echo"<tr>";
							echo "<td>".$result_tb['province']."</td>";
							echo "<td>".$result_tb['men']."</td>";
							echo "<td>".$result_tb['wemen']."</td>";

						echo"</tr>";
					}
				?>

			</tbody>
		</table>


	<script src="https://code.jquery.com/jquery-1.12.0.min.js"></script>
	<script src="https://code.highcharts.com/highcharts.js"></script>
	<script src="https://code.highcharts.com/modules/data.js"></script>
	<script src="https://code.highcharts.com/modules/exporting.js"></script>

	<script>

	$(function () {

		$('#container').highcharts({
			data: {
				//กำหนดให้ ตรงกับ id ของ table ที่จะแสดงข้อมูล
				table: 'datatable'
			},
			chart: {
				type: 'column'
			},
			title: {
				text: 'ข้อมูลจำนวนประชากร ของ แต่ละ จังหวัดประเทศใน ไทย'
			},
			yAxis: {
				allowDecimals: false,
				title: {
					text: 'Units'
				}
			},

			tooltip: {
				formatter: function () {
					return '<b>' + this.series.name + '</b><br/>' +
						this.point.y; + ' ' + this.point.name.toLowerCase();
				}
			}
		});
	});

	</script>

  </body>
</html>
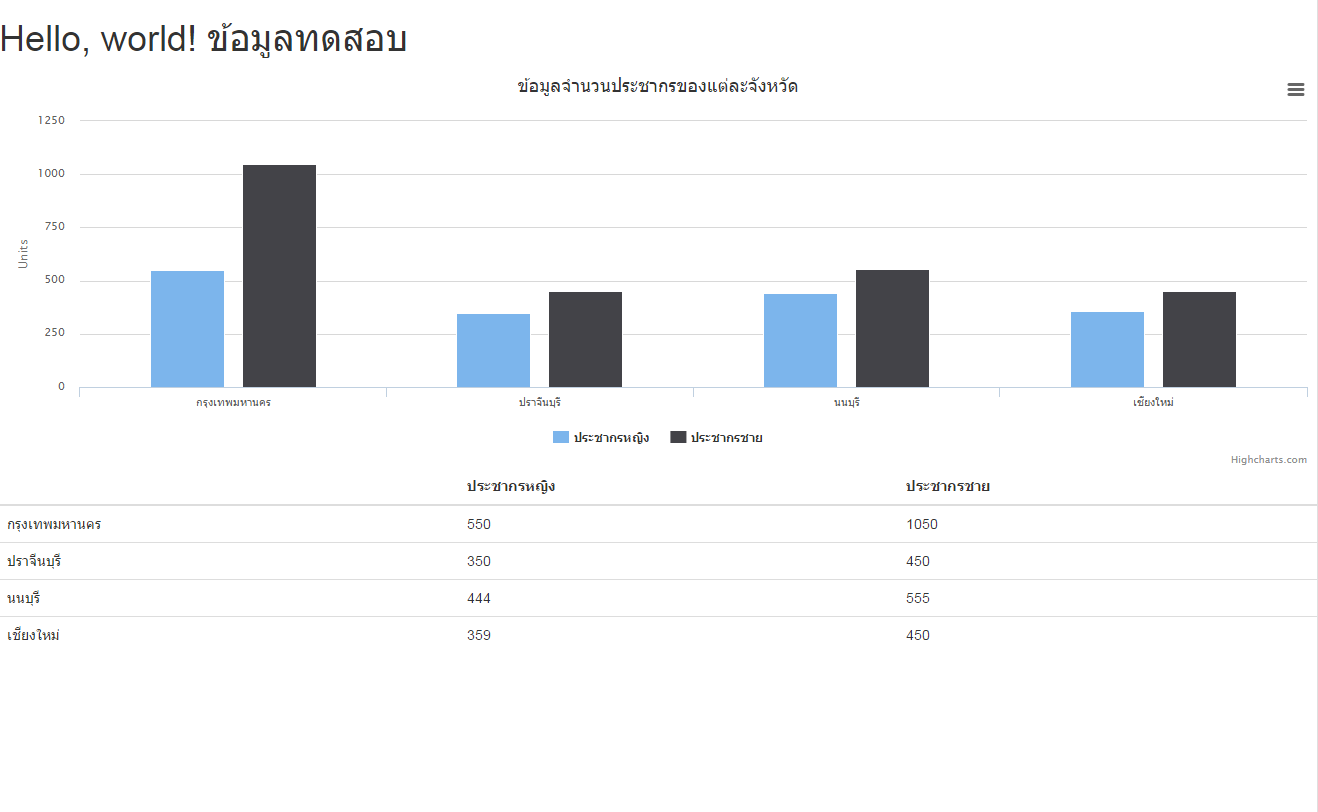
ตัวอย่างการแสดงผลข้อมูล Graph จากฐานข้อมูล MySQL
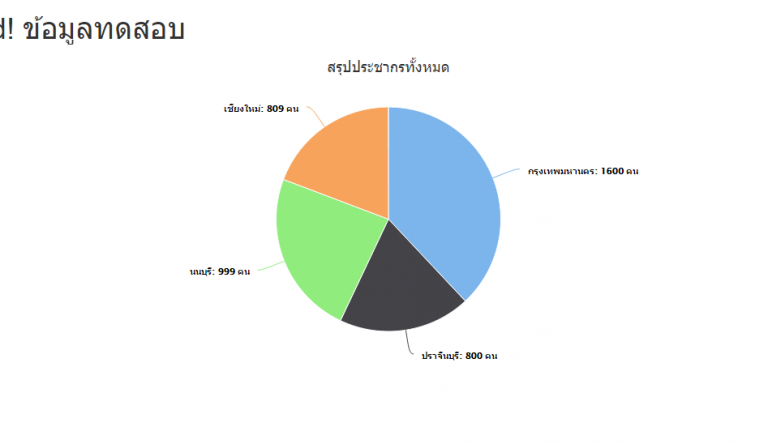
3.การแสดงขอมูลในรูปแบบ Graph วงกลม pie Chart
ตัวอย่างไฟล์ data.php
<?php

	//ตั้งค่าการเชื่อมต่อฐานข้อมูล
	$database_host 			= 'localhost';
	$database_username 		= 'root';
	$database_password 		= '';
	$database_name 			= 'demo';

	$mysqli = new mysqli($database_host, $database_username, $database_password, $database_name);
	//กำหนด charset ให้เป็น utf8 เพื่อรองรับภาษาไทย
	$mysqli->set_charset("utf8");

	//กรณีมี Error เกิดขึ้น
	if ($mysqli->connect_error) {
		die('Error : ('. $mysqli->connect_errno .') '. $mysqli->connect_error);
	}

	//เรียกข้อมูลจาก ตาราง chart
	$get_data = $mysqli->query("SELECT province as name, (men + wemen) as y FROM `chart` ");

	while($data = $get_data->fetch_assoc()){

		$result[] = $data;
	}

	echo $json = json_encode( $result, JSON_NUMERIC_CHECK);
?>
ตัวอย่างไฟล์ pie_chart.php
<!DOCTYPE html>
<html lang="en">
  <head>
    <meta charset="utf-8">
    <meta http-equiv="X-UA-Compatible" content="IE=edge">
    <meta name="viewport" content="width=device-width, initial-scale=1">
    <!-- The above 3 meta tags *must* come first in the head; any other head content must come *after* these tags -->
    <title>การใช้งาน Highcharts JS With PHP MySQL</title>

    <!-- Bootstrap -->
    <!-- Latest compiled and minified CSS -->
<link rel="stylesheet" href="https://maxcdn.bootstrapcdn.com/bootstrap/3.3.6/css/bootstrap.min.css" integrity="sha384-1q8mTJOASx8j1Au+a5WDVnPi2lkFfwwEAa8hDDdjZlpLegxhjVME1fgjWPGmkzs7" crossorigin="anonymous">

    <!-- HTML5 shim and Respond.js for IE8 support of HTML5 elements and media queries -->
    <!-- WARNING: Respond.js doesn't work if you view the page via file:// -->
    <!--[if lt IE 9]>
      <script src="https://oss.maxcdn.com/html5shiv/3.7.2/html5shiv.min.js"></script>
      <script src="https://oss.maxcdn.com/respond/1.4.2/respond.min.js"></script>
    <![endif]-->
  </head>
  <body>
    <h1>Hello, world! ข้อมูลทดสอบ</h1>

		<div id="container" style="min-width: 310px; height: 400px; margin: 0 auto"></div>

	<script src="https://code.jquery.com/jquery-1.12.0.min.js"></script>
	<script src="https://code.highcharts.com/highcharts.js"></script>
	<script src="https://code.highcharts.com/modules/data.js"></script>
	<script src="https://code.highcharts.com/modules/exporting.js"></script>

	<script>

		$(function () {

			$.getJSON("data.php",function(data){

				seriesData = data;

					$('#container').highcharts({
							chart: {
								plotBackgroundColor: null,
								plotBorderWidth: null,
								plotShadow: false,
								type: 'pie'
							},
							title: {
								text: 'สรุปประชากรทั้งหมด'
							},
							tooltip: {
								pointFormat: '{series.name}: <b>{point.percentage:.1f}%</b>'
							},
							plotOptions: {
								pie: {
									allowPointSelect: true,
									cursor: 'pointer',
									dataLabels: {
										enabled: true,
										//format: '<b>{point.name}</b>: {point.percentage:.1f} %',
										format: '<b>{point.name}</b>: {point.y} คน',
										style: {
											color: (Highcharts.theme && Highcharts.theme.contrastTextColor) || 'black'
										}
									}
								}
							},
							series: [{
								name: 'จำนวน',
								colorByPoint: true,
								data: seriesData

							}]
						});
			});

		});
	</script>

  </body>
</html>
ในตัวอย่างจะเป็นดึงข้อมูลจากไฟล์ data.php ซึ่งมีการดึงข้อมูลจากฐานข้อมูล และ ส่งกลับมาเป็น รูปแบบ Json Object ด้วย Jquery Function getJSON และ นำข้อมูล มาเก็บไว้ในตัวแปร seriesData จากนั้น function ของ highcharts จะนำค่าของ ตัวแปร seriesData ไปแสดงผลในรูปแบบ Pie Chart
หวังว่าคงเป็นประโยชน์สำหรับผู้ที่ต้องการแสดงข้อมูลในรูปแบบ Chart ต่าง ๆ ครับ สำหรับ Highcharts นั้น มี กราฟในรูปแบบต่าง ๆ มากมายครับ ในบทความนี้เป็นเพียงแค่ตัวอย่างบางส่วนเท่านั้นครับ